Footfall: Meaning, Measurement Methods Ways to Boost It
Footfall has two accepted meanings: the patter of footsteps, and, more commonly among venue operators, the simple count of people who walk through a door during a set period. We’re concerned with the latter. Whether you run a boutique, museum, or airport lounge, every visitor counted – or missed – shapes revenue, staffing and even safety limits.
This guide strips away jargon and shows how to treat footfall as a practical performance metric. You’ll learn the precise definition, the pros and cons of manual clickers, CCTV analytics and AI-powered 3D sensors, the benchmarks that really matter, and proven ways to attract more people through your doors. Ready to turn raw visitor numbers into actionable insight? Read on.

Footfall Defined: From Dictionary Term to Business KPI
Before you can measure or grow it, you need a clear definition of footfall. The next three mini-sections strip away ambiguity and set the ground rules for meaningful counting.
Literal vs Commercial Definition
The dictionary frames footfall as the sound of a step. In commerce, it simply equals the number of people crossing your threshold within a chosen period.
Footfall vs Related Terms (Foot Traffic, Visitors, Conversions)
- Footfall – total entries
- Foot traffic – movement in or outside
- Visitors – unique individuals
- Conversion rate – % of visitors buying
Industries That Track Footfall Most
Who tracks it?
- Retail – plan staff and promotions
- Shopping malls – set rents
- Museums – time exhibitions
- Libraries – prove usage
- Transport hubs – manage crowding

Why Footfall Matters for Physical Locations
Counting people is not vanity; it underpins almost every commercial and operational choice inside a bricks-and-mortar venue. Accurate footfall data allows teams to predict revenue, deploy staff efficiently, delight visitors and stay on the right side of the law.
Gauge Demand & Forecast Sales
A single equation keeps finance directors happy: Projected Revenue = Average Transaction Value × Footfall. A 5 % week-on-week dip can flag over-stocking before it hits the P&L, while a spike helps buyers secure extra inventory in time.
Optimise Staffing & Operations
Overlay hourly counts on rota sheets and you instantly spot over-manning at quiet times and under-manning during lunch rushes. Fewer wasted shifts and shorter queues translate into leaner wage bills and happier customers.
Enhance Customer Experience & Reduce Wait Times
Most shoppers bail when occupancy tips beyond comfort thresholds. Live visitor counts trigger extra tills or timed ticketing, keeping dwell times high and abandonment low.
Measure Marketing Impact & ROI
Compare like-for-like periods before and after a campaign. If footfall rises 12 % while ad spend adds £500, you have a concrete cost-per-visit to justify—or kill—the tactic.
Ensure Safety, Compliance & Space Utilisation
UK fire regulations set strict maximum occupancies. Real-time sensors alert managers when footfall nears the limit, preventing overcrowding and enabling smarter layout tweaks that squeeze more value from every square metre.
The Main Methods for Measuring Footfall
Different locations have different budgets, layouts and privacy requirements, so no single technology suits every doorway. Below are the six approaches you’ll meet most often, in roughly the order that firms adopt them as they scale.
Manual Counting (Clickers & Tally Sheets)
Staff press a handheld clicker or mark a sheet every time someone enters.
- Accuracy: 80-90 % at best
- Cost: pennies, but labour heavy
- Pros: zero installation, instant start
- Cons: human error, no overnight data, expensive on overtime
Infra-Red Beam Counters
A beam breaks when a body passes between two small units mounted on the door frame.
- Accuracy: 70-85 % (struggles with couples, trolleys)
- Pros: low hardware cost, simple fit
- Cons: can’t tell direction, counts prams twice
Video/CCTV Analytics
Software analyses existing camera feeds to detect heads or silhouettes.
- Accuracy: 85-95 % if lighting is stable
- Pros: uses current cameras, offers heatmaps
- Cons: GDPR red tape, sensitive to glare and occlusion
Wi-Fi / Bluetooth Device Tracking
Sensors “listen” for smartphones seeking a network.
- Accuracy: 50-75 % (depends on opt-out rates)
- Pros: picks up dwell time and repeat visits
- Cons: misses visitors without phones, demographic bias
AI-Powered 3D People Counters
Stereo vision sensors with deep-learning models, such as the Smart Urban Sensing 3D Pro2, map depth to isolate each person.
- Accuracy: 97-99 % even in crowds
- Pros: real-time dashboards, privacy masking, bi-directional counts
- Cons: higher upfront cost, needs PoE power
POS & Transaction Data as a Proxy
Till receipts show sales, not bodies. Use only to calculate conversion once a true count exists.
| Method | Typical Accuracy | Best For |
|---|---|---|
| Manual | 80 % | Micro shops, one-off events |
| Infra-Red | 75 % | Single-door venues on a budget |
| CCTV Analytics | 90 % | Malls with existing camera grids |
| Wi-Fi/Bluetooth | 60 % | Airports, campuses seeking dwell insights |
| 3D AI Sensors | 98 % | Retail chains needing enterprise-grade data |
| POS Receipts | n/a | Conversion analysis only |
Essential Footfall Metrics and Benchmarks
Visitor counts on their own say little; context turns them into insight. Keep the eight KPIs below on one dashboard and you’ll spot problems – or opportunities – before they hit the till.
Total vs Unique Visitors
Total shows every entry, even repeats. Unique filters out the same person within a time window (often 30 minutes) for a truer reach figure. Formula: Unique = Total – Repeat Entries.
Peak Hours, Days & Seasonal Curves
Plot hourly, daily and YoY curves to expose predictable busy spells. Align rotas, HVAC schedules and marketing pushes around those high-yield slots.
Dwell Time & Visit Duration
Average minutes spent on site. Longer isn’t always better; watch the sweet spot where spend rises before boredom sets in. Smart 3D sensors calculate this automatically.
Turn-In / Capture Rate
Capture % = Entrances ÷ Outside Traffic × 100. High-street retailers aim for 8–25 %. A falling ratio screams for sharper windows or pavement signage.
Conversion Rate (Footfall to Sales)
Conversion % = Transactions ÷ Entrances × 100. Tie store traffic to POS to see whether the sales floor, not marketing, is the leak.
Returning Visitor Rate
Returning % = Repeat Visitors ÷ Unique Visitors × 100. Rising loyalty cuts acquisition costs and boosts lifetime value.
Queue Length & Wait Time
Track people or seconds per service point. Supermarkets trigger extra tills at 4 baskets in line; museums at six-minute waits.
Industry Benchmarks Snapshot
| Sector | Conversion % | Avg. Dwell (min) |
|---|---|---|
| Fashion retail | 18–30 | 15 |
| Grocery | 35–50 | 8 |
| Quick-service restaurant | 25–40 | 10 |
| Museum/Gallery | 10–15 | 45 |
Use these ranges as a starting point, then beat them with your own data-driven tweaks.

Analysing and Interpreting Footfall Data
Raw counts are only useful once they morph into insight you can act on. The process is circular: set a benchmark, slice the data, visualise patterns, assign an action, review results, repeat. Keep it tight, pragmatic and evidence-based.
Establish Baselines & SMART KPIs
Start with a four-week rolling average to strip out one-off spikes. From there, create SMART targets such as “lift weekday capture rate from 12 % to 15 % within 90 days”. Year-on-year comparisons neutralise seasonality and public-holiday quirks.
Segment by Time, Weather, Campaign & Demographic
Meaningful trends often hide in sub-groups. Compare sunny vs rainy days, school holidays vs term time, or male vs female traffic. A damp Saturday on the UK high street typically cuts outdoor footfall by 20 % but raises mall visits by 8–10 %.
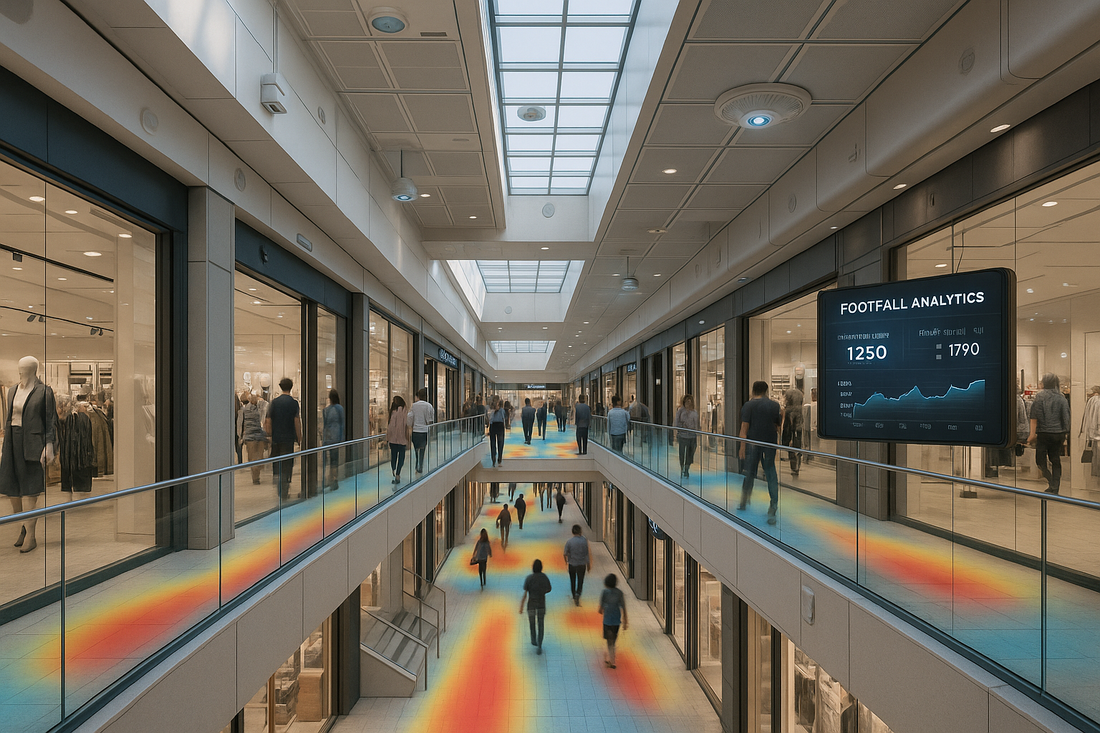
Visualise Insights with Dashboards, Heatmaps & Flow Paths
Interactive dashboards surface anomalies instantly: red blocks flag queue breaches, blue arrows expose dead zones. Layer heatmaps over floor plans to see dwell pockets and circulation pinch-points within seconds.
Translate Insights into Actionable Decisions
| Insight | Action | Expected Outcome |
|---|---|---|
| Peak shifts 30 min earlier | Move staff clock-in accordingly | Shorter queues, higher CSAT |
| Low capture on wet days | Push umbrella display outside entrance | +2 % turn-in rate |
| High bounce in back aisle | Re-merchandise with best-sellers | Longer dwell, greater basket size |
Avoid Common Data Pitfalls & Biases
Watch for double-counting at multi-door sites, ignore numbers during power cuts, and never project trends from a single promotional weekend. Validate sensors quarterly with manual counts to keep accuracy above 95 %.
Proven Tactics to Increase Footfall
Counting visitors is step one; persuading more of them to cross the threshold is where profit lives. The tactics below are field-tested across retail, culture and hospitality venues and can be mixed to suit budget, brand and neighbourhood.
Refresh Kerb Appeal & Window Displays
Why it works: Shoppers decide within three seconds whether to enter.
How to implement: Follow the “rule of three” focal points, spotlight one hero product, and rotate the set-up fortnightly to keep passers-by curious.
Run Targeted Promotions, Events & Community Tie-Ins
Why it works: Limited-time buzz triggers FOMO and widens reach through word-of-mouth.
How to implement: Host a flash sale, charity workshop or local artist pop-up; measure uplift by comparing event-day footfall with the previous four-week average.
Leverage Online-to-Offline Channels (Local SEO & Social)
Why it works: Most physical visits start with a mobile search.
How to implement: Keep your Google Business Profile updated, post daily Stories tagging “See in-store”, and offer click-and-collect to convert web interest into door swings.
Elevate In-Store Experience & Service Quality
Why it works: Positive reviews and peer talk drive repeat visits.
How to implement: Train staff to greet within five seconds, match music tempo to brand, and layer scent marketing during peak dwell periods.
Optimise Store Layout, Signage & Way-Finding
Why it works: Smooth flow reduces frustration and extends browsing time.
How to implement: Create a decompression zone, position power walls on the right, and use clear category signs validated by heat-map data.
Collaborate with Neighbouring Businesses & Pop-Ups
Why it works: Shared audiences lower acquisition costs.
How to implement: Launch a joint loyalty card, organise a street-wide late-night opening, or host rotating micro-brands in under-used corners.
Use Real-Time Data to Trigger Dynamic Actions
Why it works: Timely nudges beat static plans.
How to implement: Set occupancy alerts—if store load dips below 50 %, push a geo-fenced promo; if it exceeds 80 %, open an extra till or staff demo station.

Common Footfall Challenges and How to Overcome Them
Even with rock-solid tech, footfall programmes can stall if external shocks or data glitches creep in. The fixes below keep counts credible and decisions defensible.
Seasonal Volatility & Economic Shifts
Use rolling YoY baselines and flexible rotas to smooth peaks, cushion downturns.
External Factors: Weather, Roadworks, Competitors
Layer weather feeds, local event calendars and competitor openings to flag and offset dips early.
Counting Accuracy Issues
Schedule quarterly audits, recalibrate sensors, and position devices clear of trolleys or reflective glass.
Privacy & Compliance Concerns
Choose systems with on-device anonymisation; document lawful basis and retention in a GDPR log.
Multi-Site Consistency & Benchmarking
Standardise hardware, naming conventions and reporting periods; central dashboards keep KPIs apples-to-apples.
Quick Answers to Frequently Asked Footfall Questions
Busy managers need answers fast, so here are bite-size replies to the questions we hear most.
What Is a Good Footfall Number for a Small Retailer?
Aim for 150–300 visitors per 100 m² each week, though targets shift with rent and margin.
How Often Should I Measure Footfall?
Real-time feeds are best; at a minimum export daily totals to catch slumps early.
Can Footfall Data Predict Sales Accurately?
Pair hourly footfall with basket value and you’ll typically see a 0.6–0.8 sales correlation.
Does Online Traffic Influence Physical Footfall?
Yes—Google searches and social chatter often lift in-store traffic by five to fifteen percent.
What Is the Cheapest Way to Start Counting Visitors?
A £10 hand-held clicker works until labour cost or queue times justify automated sensors.

Key Takeaways on Driving Higher Footfall
Accurate footfall counts are the starting gun for every store-side decision. Nail the definition (‘unique people through the door’), pick a measurement method that hits 95 %+ accuracy, and track the eight core KPIs—capture, dwell, conversion and the rest. Convert numbers into insight with dashboards, seasonal baselines and simple action matrices, then test high-impact tactics: better kerb appeal, targeted events, digital-to-store funnels and real-time interventions. Finally, audit tech, adjust for weather and keep GDPR boxes ticked to maintain trust. Treat the process as a loop: measure, analyse, act, review, repeat. Ready to replace guesswork with data-driven growth? See how Smart Urban Sensing’s AI-powered 3D people counters can help you win more visitors on autopilot at Smart Urban Sensing.