What Is Foot Traffic
What Is Foot Traffic? Definition, Metrics & Growth Tips
Foot traffic (also called “footfall”) is the number of people who physically enter, pass by, or move within a location during a given period. It is the heartbeat of bricks-and-mortar commerce: every visitor represents potential revenue, informs staffing levels, shapes customer experience, and even influences lease negotiations and property valuations. Whether you manage a single boutique, a chain of cafés, or a national museum, knowing how many people cross the threshold—and what they do once inside—turns guesswork into profitable action.
This article strips away the buzzwords and shows you exactly how to make foot traffic work for you. You will learn the core metrics that matter, the technology options for measuring them, and the analytical tricks that convert raw counts into strategic insight. We will round off with proven tactics to grow your numbers and a quick-fire FAQ for busy managers. Let’s start by unpacking the term itself and why it has become indispensable for modern retailers and venue managers.
Foot Traffic Explained: Definition, Synonyms, and Why It Matters
Ask ten managers to define “foot traffic” and you will hear a handful of terms—footfall, pedestrian count, in-store traffic—all pointing to the same baseline metric: how many people move through a physical space within a set time frame. On its own, the figure is a simple head-count; when paired with sales, staffing, and marketing data it morphs into a high-impact KPI that shapes everything from shop-floor rotas to board-level investment decisions.
Because it captures real human presence, foot traffic sits at the crossroads of multiple industries. Retail chains, restaurants, museums, airports, stadiums, even office landlords treat the metric as a proxy for revenue potential and operational strain. In short, if the success of your venue depends on bodies through a door, you need to understand what foot traffic is and how to wield it.
Foot Traffic vs Footfall vs Pedestrian Count
- Foot traffic: Common in North America; often searched as “what is foot traffic”.
- Footfall: Preferred in the UK and much of Europe; interchangeable in reporting dashboards.
- Pedestrian count: Broader urban-planning term that can include passers-by who never enter the premises.
Search data reveals all three phrases spike around retail peak seasons, so savvy analysts tag them together to capture every relevant query and ensure consistent internal reporting.
Why Retailers and Venue Managers Track Foot Traffic
Tracking visitor flow unlocks five core pay-offs:
- Revenue forecasting and true conversion rate
(transactions ÷ visitors) × 100. - Data-driven staff scheduling that cuts overtime and queues.
- Layout and merchandising tweaks based on dwell-time heatmaps.
- Evidence for rent negotiations or profit-share leases.
- Marketing attribution—did this weekend’s influencer event deliver incremental visits?
Quick example: A city museum noticed that 60 % of guests skipped its west wing. By relocating a headline exhibit nearer the entrance, overall dwell time rose 18 % and gift-shop sales jumped £2.40 per visitor.
Core Foot Traffic Metrics You Should Monitor
Counting heads is a start, but a lone tally will not tell you why shoppers buy, queues build, or marketing flops. Real insight comes from layering complementary KPIs into a single dashboard so patterns jump out and decisions become obvious. Below are the five metrics that should sit on every store or venue manager’s screen.
Overall Visitor Count
The baseline figure: how many individuals cross an entrance during a set window. It is usually calculated by threshold counting—every time the beam (or camera zone) is broken, the system adds 1.overall_visitor_count = Σ (entries detected across all doors)
This metric feeds every ratio that follows, so invest in sensors that keep accuracy within ±3 %.
Peak Hours and Dwell Time
Peak hours reveal when your space is busiest; dwell time shows how long people stick around. AI heat-mapping highlights hotspots so you can move merchandise or exhibits accordingly.average_dwell_time = total_time_spent ÷ visitor_count
Example: A coffee bar saw dwell rise from 7 min to 15 min after adding USB charging points—proof the change worked.
Conversion Rate and Sales per Visitor
Foot traffic only matters if it turns into pounds. Track:conversion_rate = (transactions ÷ visitor_count) × 100sales_per_visitor = total_sales £ ÷ visitor_count
A high visitor count paired with a sagging conversion rate flags merchandising or pricing issues rather than marketing reach.
Repeat vs New Visitors
Loyalty apps, hashed Wi-Fi MACs, or POS IDs help classify guests anonymously. Seeing repeat visits climb is a healthy sign; spiralling one-and-done traffic can indicate experience gaps or fickle promotions. Segmenting allows you to target retention campaigns and calculate true customer lifetime value.
Average Queue Length and Wait Time
Crowds that cannot move will not spend. Sensors mounted above tills or ticket desks feed real-time queue KPIs:average_wait_time = total_queue_minutes ÷ queued_visitors
Trigger alerts when thresholds are breached so extra staff can jump in. Even shaving 30 seconds off perceived waiting can lift basket size and NPS scores.
Combine the metrics above and your “people count” transforms from a passive number into an operational steering wheel.
How to Measure Foot Traffic Accurately
Trustworthy numbers underpin every ratio in your dashboard. A ±3 % error margin might tweak staffing by a person or two; a ±15 % swing can wipe out the entire profit of a Saturday trade. Before choosing a method, map the physical characteristics of your site (entrance width, ceiling height, number of doors) and the insight you actually need. The tools below are arranged from the simplest head-counts to multi-layer data ecosystems.
Manual Counting and Clicker Methods (Pros & Cons)
The classic option is a hand-held tally counter at the door.
Pros
- Zero hardware cost, instant deployment
- Useful for short-term studies or pop-ups
Cons
- Human fatigue and bias creep in after minutes, not hours
- Limited coverage outside staffed periods
- Hard to split in-bound vs out-bound flows
Expect accuracy to drift from 95 % at the start of a shift to below 80 % by the end.
Infra-red Beams and Basic Sensors
A break-beam sits across the doorway; each interruption counts as one. Installation is quick and inexpensive.
- Typical accuracy: 80–90 %
- Struggles with groups, prams or trolleys—one wide object may equal many people
- Provides only a raw
count, no direction or dwell time
Good for small entrances where price sensitivity trumps granular insight.
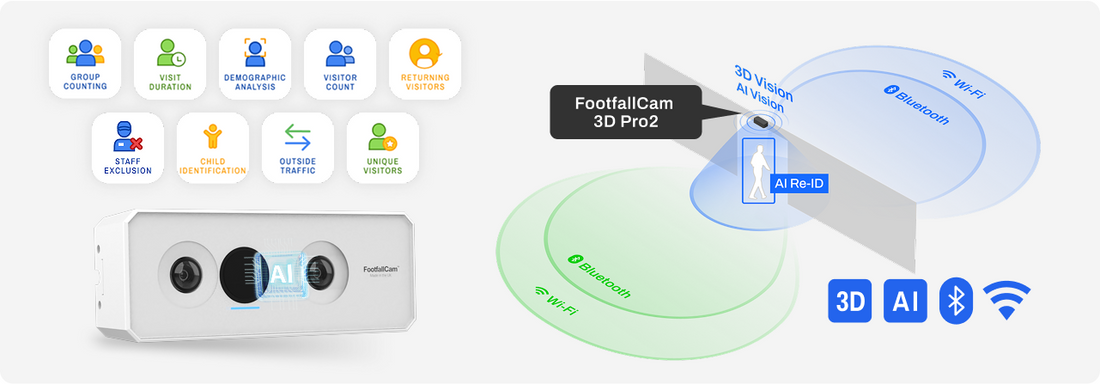
AI-Powered 3D People Counters and Video Analytics
Stereo cameras generate depth maps while on-device AI distinguishes humans from objects, filtering by height and direction.
- Accuracy regularly tops 95 % even in bi-directional traffic
- Captures dwell time, path analysis and live occupancy across multiple doors
- Integrates with cloud dashboards for real-time alerts
Investment is higher, but the cost per actionable insight is usually lower—hence its adoption by airports, malls and Smart Urban Sensing clients.
Wi-Fi / Mobile Device Tracking and Geolocation Data
Ceiling-mounted access points sniff anonymous probe requests; outdoor venues tap cellular data providers.
- Great for large precincts where cameras are impractical
- Delivers repeat-visit rates and journey paths
- Sample bias: visitors with Wi-Fi disabled vanish from the dataset
Combine with cameras to validate calibration.
Using POS Data and CRM Integrations for Richer Insights
Link your people counter to the till and loyalty app via API. Align timestamps so you can match visitor_id → basket → margin. This turns foot traffic into a revenue attribution engine, not just a body count.
Data Privacy and Compliance Considerations (GDPR, CCPA)
Accuracy is pointless if it breaks the law. Follow three golden rules:
- Collect the minimum data required for the stated purpose.
- Anonymise or hash identifiers at the edge device.
- Provide clear signage and opt-out mechanisms.
Conduct a Data Protection Impact Assessment (DPIA) and retain raw footage only as long as operationally necessary. Respecting privacy keeps regulators—and your customers—on side while you perfect the numbers behind what is foot traffic in your venue.
Analysing Foot Traffic Data for Actionable Insights
Collecting accurate counts is only half the battle; the other half is translating them into decisions that move the P&L. Once your sensors feed a clean data stream, drop the numbers into weekly and monthly dashboards, then ask “so what?” The H3 sections below outline the five quickest wins you can pull straight from the data, no data-science PhD required.
Identifying Traffic Patterns by Time, Day, Season
Plot visitors on a heatmap that stacks days on one axis and half-hour slots on the other. The red blocks expose Monday-morning lulls or Saturday-afternoon spikes, while a 12-month view highlights holiday peaks. Year-on-year comparison corrects for one-off calendar shifts and shows genuine growth.
Correlating Marketing Campaigns with Visitor Uplift
Tag every campaign launch in your analytics platform. Compare the average daily foot count in the two weeks before and after the activity, then calculate the incremental cost per visit. A 15 % lift from an influencer pop-up beats a 3 % bump from blanket discounting every time.
Staffing and Operational Optimisation
Overlay live occupancy on rota data. If queues exceed your two-minute SLA, trigger an automatic SMS that pulls back-office staff to tills. Clients who synchronise staffing with traffic typically cut overtime by 8–12 % and raise customer-satisfaction scores in one quarter.
Store Layout, Merchandising, and Signage Evaluation
Path analysis shows where visitors slow down or abandon the journey entirely. Relocating impulse lines to high-dwell zones or adding directional signage to cold corners can lift add-on sales without a single extra visitor. Test, measure for two weeks, repeat.
Benchmarking Against Industry Standards
Finally, sanity-check your KPIs against sector norms—e.g. 3 % weekday conversion for fashion boutiques, 10 min average dwell in QSR, 45 % repeat rate for mid-size museums. Benchmarking prevents knee-jerk reactions to seasonal dips and keeps the “what is foot traffic worth?” debate grounded in facts.
Proven Strategies to Increase Foot Traffic
A bigger marketing budget is not the only way to put more feet through the door. The six tactics below are field-tested, relatively low cost, and—crucially—measurable against the KPIs we covered earlier. Mix and match, track the impact, then double-down on what moves the needle.
Enhancing Curb Appeal and Window Displays
First impressions start at pavement level.
- Refresh window visuals every 4–6 weeks to avoid “banner blindness”.
- Use contrasting lighting and motion (e.g., rotating plinths) to lift pass-by conversion—the ratio of people who look vs enter.
- Add scent or background audio to push average dwell time outside.
Local SEO and Google Business Profile Optimisation
Most in-person visits begin with a search.
- Keep NAP (name, address, phone) consistent and upload geotagged photos so Google’s “Popular times” graph is accurate.
- Post weekly offers with UTM codes; compare click-throughs to incremental visitors in your counter.
- Encourage reviews—locations with 4 ★+ ratings appear in the “pin pack” 25 % more often.
In-Store Events, Workshops, and Experiential Marketing
Give customers a reason to visit today, not “sometime”.
- Host product demos, artist meet-ups, or mini-classes; advertise limited spaces to create FOMO.
- Measure event footfall uplift and watch for spikes in repeat visitor rate the following month.
Omnichannel Promotions and Click-and-Collect
Blur the line between online and offline.
- Offer in-store pickup with a timed discount (“10 % off anything added at collection”).
- Typical uplift: click-and-collect shoppers spend 20–30 % more, raising sales per visitor without extra marketing spend.
Partnerships with Neighbouring Businesses and Community Engagement
Think beyond your four walls.
- Swap window flyers or run a joint loyalty card with nearby cafés.
- Sponsor local charity runs or school fairs; note the new-visitor percentage during the campaign window.
Leveraging Real-Time Occupancy Alerts for Queue Management
Nothing kills spending like a bottleneck.
- Display live capacity on digital signage and in your app.
- Trigger staff redeployment when queue length >5 people or wait time >2 min.
- One gym using occupancy alerts saw an 8 % rise in peak-time entries and a 12 % drop in early exits.
Track, tweak, repeat—the data will tell you which levers genuinely increase foot traffic and which are just noise.
Common Foot Traffic Challenges and How to Overcome Them
Even with accurate sensors and flashy dashboards, a few potholes can skew your numbers or choke visitor flow. Below are the five problems managers report most often—plus the quickest way to fix each one.
Low Foot Traffic Despite Heavy Marketing Spend
Check audience-channel alignment, creative fatigue, and timing. Map campaign postcode reach against your best-buyer profile, then A/B-test hyper-local ads. Replace broad discounts with experience-led hooks and track incremental visitor lift within 48 hours.
Seasonal Fluctuations and External Factors
Weather shocks, tourism cycles, or rail strikes can tank numbers overnight. Maintain a contingency calendar: pop-up displays, indoor promos, flexible staff rotas. Benchmark against the same week last year, not last month, to avoid false alarms.
Measuring Multi-Entrance or Open-Plan Venues
Equip every ingress with ceiling-mounted sensors and run de-duplication logic to merge paths. Position extra counters above escalators and zone boundaries. Calibrate quarterly with manual spot checks to keep error below ±3 %.
Interpreting Data with Limited Analytical Resources
No data scientist? Schedule automated email summaries that flag anomalies more than two standard deviations from trend. Use colour-coded dashboards and short “why it matters” captions. Outsource a monthly deep dive until internal skills catch up.
Balancing Customer Privacy with Data Collection
Post clear signage, anonymise IDs at the device, and purge raw footage after export. Complete a DPIA, log consent preferences, and offer a QR-code opt-out. Privacy-by-design keeps regulators—and customers—firmly on your side.
Quick Answers to Popular Foot Traffic Questions
Pressed for time? The cheat-sheet below serves up rapid, evidence-based answers to the four queries managers Google most.
What Is Considered High Foot Traffic?
In urban convenience retail, anything above 500 visitors per square metre per week is classed as high. For destination museums, 5–7 visitors per square metre per day hits the same benchmark. Always judge numbers against venue size and trading pattern before labelling them “high”.
What Industries Rely Most on Foot Traffic?
Top of the list are retail (fashion, grocery, electronics), food & beverage outlets, transport hubs, entertainment venues, tourist attractions, and walk-in healthcare clinics. In each case, visitor volume directly underpins revenue or service efficiency.
How Often Should a Business Audit Its Foot Traffic Data?
Automate daily collection, review weekly for operational tweaks, and conduct a deeper quarterly audit that checks sensor accuracy, compares year-on-year trends, and resets targets ahead of peak seasons.
Is Foot Traffic Still Relevant in the E-Commerce Era?
Absolutely. Click-and-collect, showrooming, and returns overlap create a “phygital” loop where in-store visits influence online sales and vice versa. Physical traffic remains a critical lever in omnichannel profitability.
Putting Foot Traffic Insights to Work
Collecting numbers is only half the job; the real win comes when you loop data back into daily operations. Track the metrics we covered, test one growth tactic at a time, and watch how conversion rate, dwell time, and repeat visits respond. When something moves in the right direction, document the uplift, standardise the change, and move on to the next hypothesis. Over a few cycles, this rinse-and-repeat approach compounds into higher revenue, smoother staffing, and happier customers.
If you are ready to swap gut feel for evidence-based action, explore how AI-powered 3D people counting from Smart Urban Sensing delivers the pinpoint accuracy and real-time dashboards you need to close the loop—turning the question “what is foot traffic?” into a measurable competitive edge.